
Space and Plasma Physics
EDUCATION

Space and Plasma Physics
EDUCATION
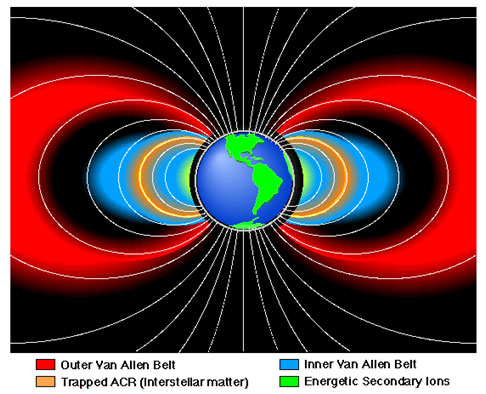
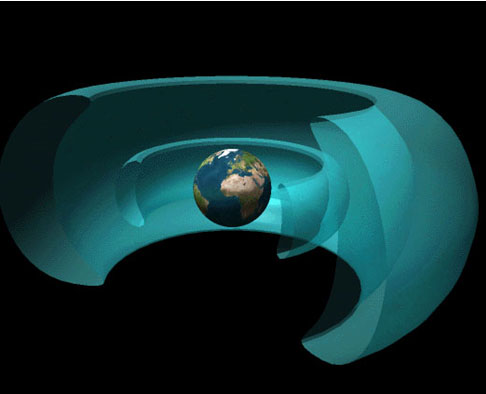
Radiation Belts: The Big Picture
Education and Outreach
Space Weather Applications:
Astronauts safety
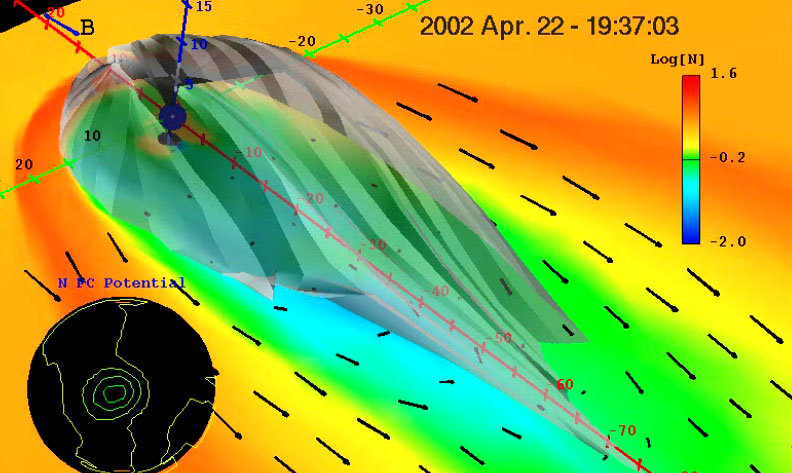
Substorm and storm dynamics of Earth's magnetosphere. A movie example is developed for Apr. 22, 2002 storm event and provides a global view of complex dynamical behavior of the Earth's magnetosphere and ionosphere. The semi-transparent grey mantle is the 3D envelope of the last-closed Earth's magnetic field lines. Plasma flows are shown in black arrows and the density of the plasma is also shown in colors that denote large (red) and small (blue) values. Contours in black circle show evolutions of electric field inside Earth's ionosphere (~ 100 km above Earth's surface).
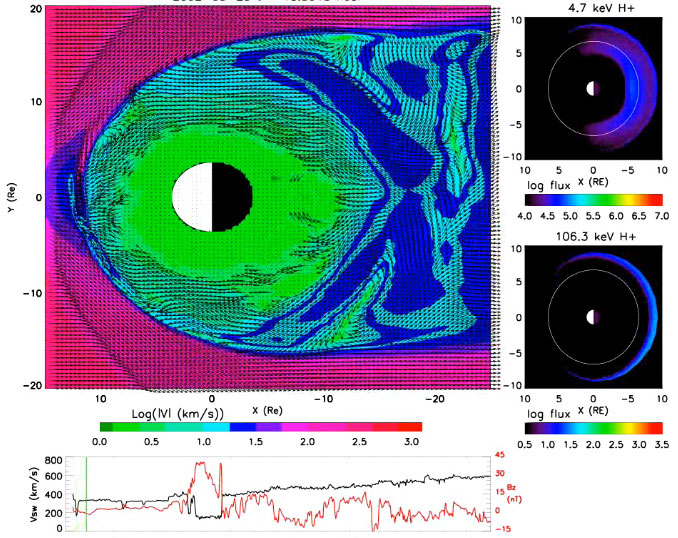
Vortices structure and Ring Current development inside the magnetosphere during Mar. 29, 2002 magnetic storm events. Bottom panel shows evolution of the solar wind conditions. Upper left channel shows the plasma velocity vectors overlaid on top of the colormap of the velocity amplitude. The two panels on the right show the evolution of ring current particles (protons) in two energy channels. In responding the solar wind's perturbations, vortices structure and ring current are developed and showing dynamic inside the earth's magnetosphere.
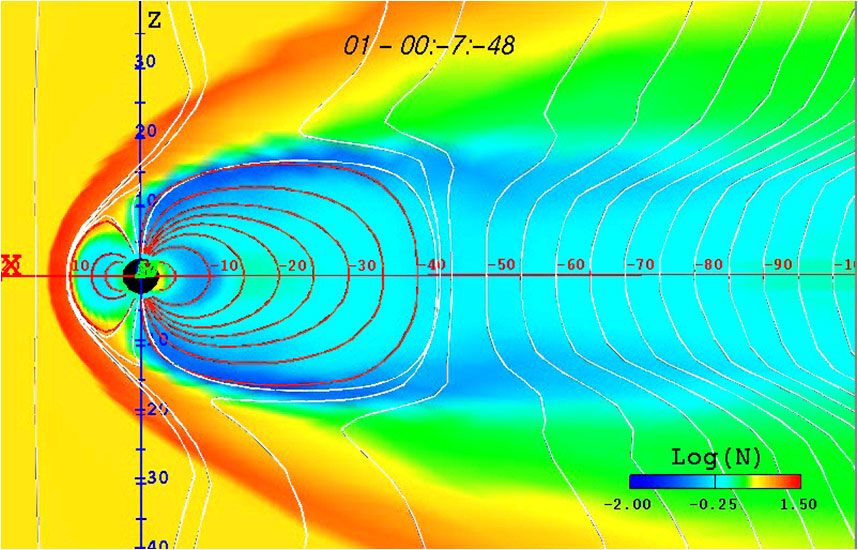
When Earth's magnetic field is distributed by a solar storm event, many changes occur which lead to complex rearrangements of earth's magnetosphere, and the particles that flow within it. This animation was calculated for one such 'magnetospheric substorm' to show the complexity of these rearrangements. The lines are a dew of the magnetic field lines from earth. The density of the trapped plasma (charged particles) is shown in colors that denote large and small values.
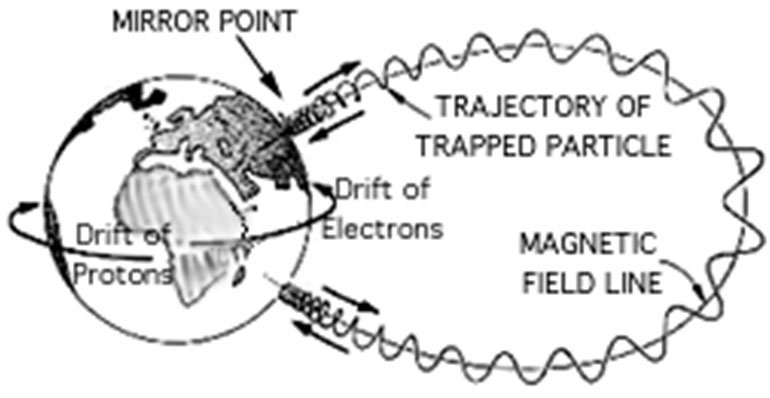
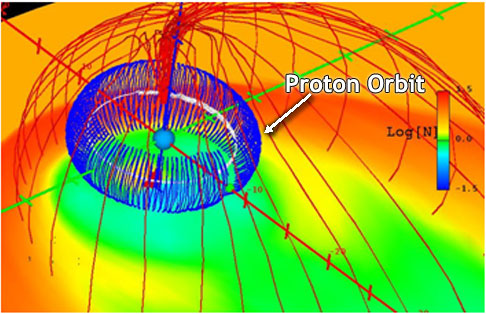
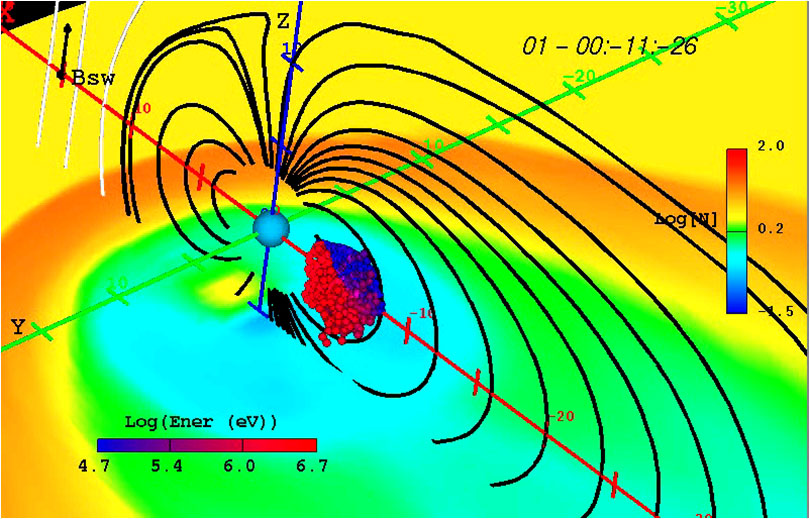
As the magnetic field of Earth undergoes a storm, trapped particles flow in specific ways as magnetic field of Earth undergoes a storm, trapped particles flow in specific ways as magnetic field compress and energize them. This computer model animates how protons (the nuclei of hydrogen atoms) flow within a radiation belt during a magnetic substorm. The lines are the magnetic field lines of earth, and the balls represent a few of the trillions of protons which are flowing in the various belts and currents. The colors represent the different energies carried by the protons. It can be noticed that energetic protons circle around the earth counter-clockwisely.
Earth's Radiation Belt
By: Dr. Xi Shao
This presentation is about Earth's radiation belt observations, geomagnetic storms and sub storms, modeling formation of Earth's radiation belt and slot region formation. The target audience is the general public.
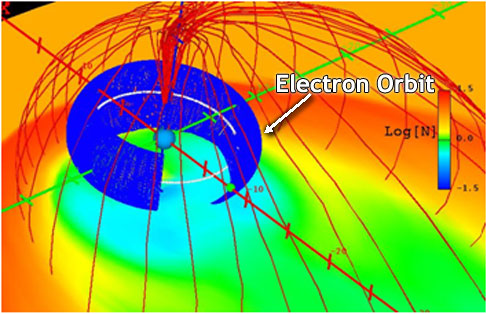
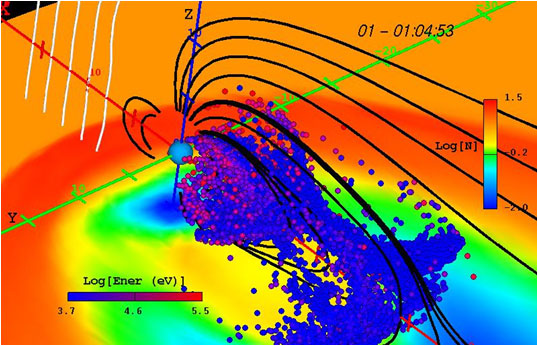
At the same time the protons are flowing around Earth and being energized by magnetic forces, electrons are also flowing in similar regions of space. This computer model shows many similarities and differences between the electron belts and the proton belts. As before, the colors represent the various energies of the electrons while the lines represent the calculated locations of Earth's magnetic field. It can be noticed that energetic electrons circle around the earth counter-clockwisely.
Presentations
Interactive Radiation Belt Database
Radiation Belt Database
NOAA POES satellite data covering 20 years continuous observations of Earth's radiation belt particles (protons and electrons) have been processed and make available to the public through CDAWeb of NASA. Currently, it is available to the public through CDAWeb of NASA. Currently, it is available at http://cdaweb.gsfc.nasa.gov/sp_test/ (select NOAA). This radiation belt database will be officially released in September, 2007 along with the documentation by Tan et al., [2007]. Part of Xi Shao's work on this data product is supported through NASA Grant.
Magnetospheric State Query System
By: Dr. Xi Shao
An interactive Magnetospheric State Query (MSQS) is developed and maintained by Dr. Shing F. FUng and Xi Shao and hosted at http://radbelts.gsfc.nasa.gov/RB_model_int/Psi_database.html. From this web page, the user can select time intervals when a set of user-specified geophysical conditions occurred. Time intervals from MSQS can be used directly to select, retrieve, and analyze the observations associated with a given magnetospheric state [Fung and Shao, 2007].
The Development of this educational
web page is supported by NASA Grant -05-NIP
Award # NNX06AE88g, (PI: Dr. Xi Shao)
Questions and Comments sent to Dr. Xi Shao (xshcn@astro.umd.edu)